Apsalar Dashboard Redesign
Apsalar provides attribution and audience-building services for mobile app developers. As the sole designer at Apsalar, I was responsible for the full spectrum of design activities required to support the service.
The Apsalar dashboard had a problem: it didn't get used. Good dashboards allow users to see vital information at a glance, and from previous research I knew our dashboard didn’t do that. The product had undergone a major change in business strategy, but the dashboard was missing data from many of the highest-value features. Finally, the visual style needed updating and we lacked an empty state to show users who hadn’t set up their accounts yet.
Goal Setting and Research
I started the redesign by completing a competitive analysis to see what data other analytics companies were providing on their dashboards, and then conducted user interviews to understand what metrics app marketers use to assess the health of their applications. I found that users wanted to see various metrics daily and about a single application, and to compare recent performance with past.
Initial Design and User Testing
Based on user interviews, I designed two versions of our dashboard. Because our users repeatedly mentioned that they wanted “just the data,” one version of the dashboard showed only data values and had no visualizations. The other version of the dashboard used sparklines, a type of data visualization meant to give the viewer a snapshot of a datapoint and some context about the relative value of that datapoint.
It turned out that neither version of the dashboard tested well. The data-only version was too overwhelming. People reported that the sparkline version was appealing, but after the initial favorable reaction, most people didn’t know how to interpret the graphs. I took the findings and created another round of wireframes:
Final Design
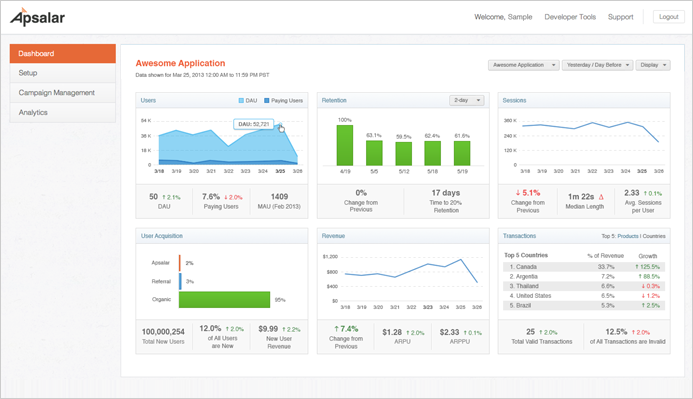
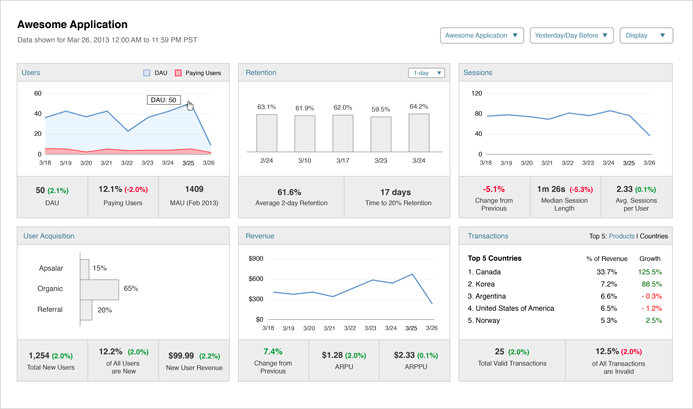
The final design of the dashboard grouped related metrics around a single graph. I visualized the most important data point in each category, and used the other metrics to provide supporting data and context. Users can elect to see data from today or yesterday compared to the past seven days, and can also elect to hide or show individual metrics or whole panels.
The empty state of the dashboard provides new users with a welcoming experience and directs them to the next step in account creation. It also allows users to try a demo version the product. Since the release of the new dashboard, we’ve seen a 6% increase in the time that people spend on the dashboard, as well as a 78% reduction in bounce rate.